Been having internet problems lately. I would usually wait until things got bad and then do network traces with MTR and point out where the problem was. Would also text neighbors to see if they were also down (they always were) just to verify that it wasn’t just my own home wiring or equipment.
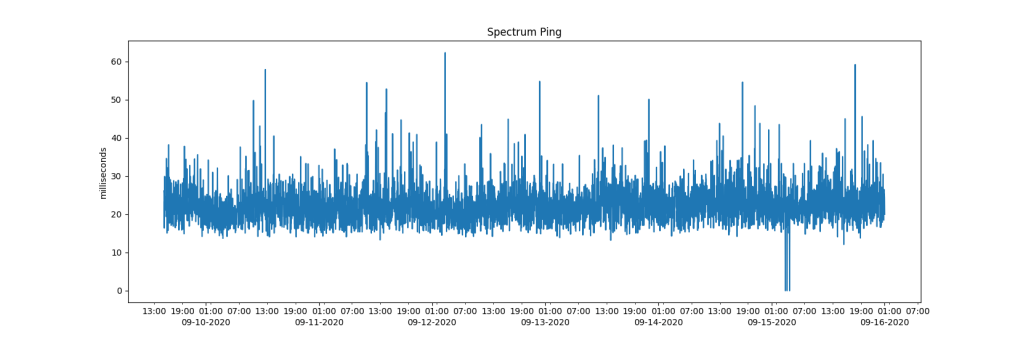
Not getting much traction with Spectrum, I started logging network data to see exactly when and how bad the latency problems were. I even used a dedicated, wired, Raspberry Pi Zero to make sure the numbers weren’t wobbly due to wifi or other software running on my host.
The end result is two smallish but powerful logging and plotting programs I have shared on GitHub. The Logger is actually similar to an industrial strength tool I wrote for a large bank that was deployed on thousands of production servers. Enjoy.

Nice contribution. And glad to see that you still abide to the high coding standards that you established long ago.
LikeLike